In seeking to understand the implications of this latest paper from Hansen et al (see my earlier posts), a useful place to start is with Hansen’s observation that:
“…Hansen (2007) suggested that a 10-year doubling time was plausible pointing out that such a doubling time from a base of 1 mm per year ice sheet contribution to sea level in the decade 2005-2015 would lead to a cumulative 5 m sea level rise by 2095. ”
While we know that in fact the 2005-2015 base to start the doubling from is probably somewhat higher than that.
As with any compounding calculation the final result is very dependent on the starting conditions. Hansen notes in the paper that recent data suggests a 6 to 8 year doubling rather than the 10 year he uses in Figure 7. So his sea level rise in 2100 is very ‘conservative’.
2011/01/22
2011/01/19
Hansen 5 metres by 2100...
From Hansen today in addition to my previous post:
Its worth reading the paper in full, please:
http://www.columbia.edu/~jeh1/mailings/2011/20110118_MilankovicPaper.pdf
Hansen says:

...These projections are typically a factor of 3-4 larger than the IPCC (2007) estimates, and thus they altered perceptions about the potential magnitude of human-caused sea level change.
...
And from me in 2009, taking an empirical view...

As noted in earlier postings, once ice sheet disintegration gets under way, unless there is some drastic (and currently not anticipated) reversal in climate forcings the process will simply continue until the bulk of the ice sheets are gone.
We're on our way to a very wet and wild time!
Its worth reading the paper in full, please:
http://www.columbia.edu/~jeh1/mailings/2011/20110118_MilankovicPaper.pdf
Hansen says:

Fig. 7. Five-meter sea level change in 21st century under assumption of linear change (Alley, 2010) and exponential change (Hansen, 2007), the latter with a 10-year doubling time.
Alley (2010) reviewed projections of sea level rise by 2100, showing several clustered around 1 m and one outlier at 5 m, all of which he approximated as linear. The 5 m estimate is what Hansen (2007) suggested was possible, given the assumption of a typical IPCC's BAU climate forcing scenario. Alley's graph is comforting, making the suggestion of a possible 5 m sea level rise seem to be an improbable outlier, because, in addition to disagreeing with all other projections, a half-meter sea level rise in the next 10 years is preposterous.
However, the fundamental issue is linearity versus non-linearity. Hansen (2005, 2007) argues that amplifying feedbacks make ice sheet disintegration necessarily highly non-linear. In a non-linear problem, the most relevant number for projecting sea level rise is the doubling time for the rate of mass loss. Hansen (2007) suggested that a 10-year doubling time was plausible pointing out that such a doubling time from a base of 1 mm per year ice sheet contribution to sea level in the decade 2005-2015 would lead to a cumulative 5 m sea level rise by 2095.
...
By mid-century most of Greenland would be experiencing summer melting in a longer melt season. Also some Greenland ice stream outlets are in valleys with bedrock below sea level. As the terminus of an ice stream retreats inland, glacier sidewalls can collapse, creating a wider pathway for disgorging ice.
...
PIG and neighboring glaciers in the Amundsen Sea sector of West Antarctica, which are also accelerating, contain enough ice to contribute 1-2 m to sea level. Most of West Antarctica, with at least 5 m of sea level, and about a third of East Antarctica, with another 15-20 m of sea level, are grounded below sea level. This more vulnerable ice may have been the source of the 25 ± 10 m sea level rise of the Pliocene (Dowsett et al., 1990, 1994). If human-made global warming reaches Pliocene levels this century, as expected under BAU scenarios, these greater volumes of ice will surely begin to contribute to sea level change. Indeed, satellite gravity and radar interferometry data reveal that the Totten Glacier of East Antarctica, which fronts a large ice mass grounded below sea level, is already beginning to lose mass (Rignot et al., 2008).
...
These data records are too short to provide a reliable evaluation of the doubling time, but, such as they are, they yield a best fit doubling time for annual mass loss of 5-6 years for both Greenland and Antarctica., consistent with the approximate doubling of annual mass loss in the period 2003-2008. There is substantial variation among alternative analyses of the gravity field data (Sorensen and Forsberg, 2010), but all analyses have an increasing mass loss with time, providing at least a tentative indication that long-term ice loss mass will be non-linear.
We conclude that available data for the ice sheet mass change are consistent with our expectation of a non-linear response, but the data record is too short and uncertain to allow quantitative assessment. The opportunity for assessment will rapidly improve in coming years if high-precision gravity measurements are continued.
Finally, we note the existence of a strong negative feedback described by Hansen (2009) that comes into play when the rate of sea level rise approaches the order of a meter per decade. Such an iceberg discharge rate temporarily overwhelms greenhouse warming, cooling high latitude atmosphere and ocean mixed layer below current levels. Ice sheet mass loss may slow in response to this cooling, but, as described qualitatively by Hansen (2009), it will be no consolation to humans. Stronger storms driven by increased latitudinal temperature gradients, combined with multi-meter sea level rise, will produce global havoc.
...
However, we must expect ice sheet mass balance changes will occur simultaneously in both hemispheres. Why? Because ice sheets in both hemispheres were in near-equilibrium with Holocene temperatures. That is probably why both Greenland and Antarctica began to shed ice in the past decade or so, because global temperature is just rising above the Holocene level.
Ice sheet disintegration in Antarctica depends on melting the underside of ice shelves as the ocean warms, a process well underway at the Pine Island glacier (Scott et al., 2009). The glacier's grounding line has retreated inland by tens of kilometers (Jenkins et al., 2010) and thinning of the ice sheet has spread inland hundreds of kilometers (Wingham et al., 2009).
...
d. Scenarios and predictions
Predictions of future sea level change are inherently difficult because, we assert, ice sheet disintegration is fundamentally a non-linear process. However, in addition, the climate forcing scenario is uncertain. When predictions are made, or statements that can be construed as predictions, it is important to be clear what climate forcing scenario is being considered.
IPCC BAU (business-as-usual) scenarios assume that greenhouse gas emissions will continue to increase, with the nations of the world burning most of the fossil fuels including unconventional fossil fuels such as tar sands.
An alternative extreme, one that places a substantial rising price on carbon emissions, would have CO2 emissions beginning to decrease within less than a decade, as the world moves on energy systems beyond fossil fuels, leaving most of the remaining coal and unconventional fossil fuels in the ground. In this extreme scenario, let's call it fossil fuel phase-out (FFPO), CO2 would rise above 400 ppm but begin a long decline by mid-century (Hansen et al., 2008).
The European Union 2°C scenario, call it EU2C, falls in between these two extremes.
BAU scenarios result in global warming of the order of 3-6°C. It is this scenario for which we assert that multi-meter sea level rise on the century time scale are not only possible, but almost dead certain. Such a huge rapidly increasing climate forcing dwarfs anything in the peleoclimate record. Antarctic ice shelves would disappear and the lower reaches of the Antarctic ice sheets would experience summer melt comparable to that on Greenland today.
The other extreme scenario, FFPO, does not eliminate the possibility of multi-meter sea level rise, but it leaves the time scale for ice sheet disintegration very uncertain, possibly very long. If the time scale is several centuries, then it may be possible to avoid large sea level rise by decreasing emissions fast enough to cause atmospheric greenhouse gases to decline in amount.
What about the intermediate scenario, EU2C? We have presented evidence in this paper that prior interglacial periods were less than 1°C warmer than the Holocene maximum. If we are correct in that conclusion, the EU2C scenario implies a sea level rise of many meters. It is difficult to predict a time scale for the sea level rise, but it would be dangerous and foolish to take such a global warming scenario as a goal.
.End.
And from me in 2009, taking an empirical view...

Nigel Williams' estimate of sea level rise. Note the exponential curve through 5 metres rise at 2100,
As noted in earlier postings, once ice sheet disintegration gets under way, unless there is some drastic (and currently not anticipated) reversal in climate forcings the process will simply continue until the bulk of the ice sheets are gone.
We're on our way to a very wet and wild time!
Hansen: "...implying the possibility of multi-meter sea level rise this century."
A draft of a paper by Hansen et al just out today..
Paleoclimate Implications for Human-Made Climate Change
James E. Hansen and Makiko Sato, January 2011
http://www.columbia.edu/~jeh1/mailings/2011/20110118_MilankovicPaper.pdf
Abstract:
"... Deglaciation, disintegration of ice sheets, is nonlinear, spurred by amplifying feedbacks. If warming reaches a level that forces deglaciation, the rate of sea level rise will depend on the doubling time for ice sheet mass loss. Gravity satellite data, although too brief to be conclusive, are consistent with a doubling time of 10 years or less, implying the possibility of multi-meter sea level rise this century. "
As I was saying...!
2011/01/11
It is a moral issue.
In response to a post in Hot-topic.co.nz I suggested that the solution to the present issues confronting us can best be addressed by moral force:-
"Erentz; I most respectfully but strongly disagree with your contention that government is a necessary element in the process of advancing the change required.
I see the issue as a moral issue, not one that 'government' can or even needs to get involved in.
We are told repeatedly by 'government' that the market can lead to change in the products and systems we have to use; carbon-free transport for example. If that is the case, (and it has been for a while) then we-the-market can choose to force those changes.
For example I suggested at a City Council hearing that the most effective thing our city could do to reduce food miles and non-recyclable packaging would be to include a dozen sheets of small stickers which read "I didn't buy this product today because it came from too far away!" and "I didn't buy this product today because the packaging is not sustainably produced or recyclable!". Include these with every notice to householders for a year for them to take with them shopping and the change would be remarkable. They saw the threat to their commercial rates-base however, and demurred.
The moral issue here is well known to most of us:-
It is wrong to keep on doing what we are doing to the Earth. It is wrong because it is having an impact on all of us today, and the impacts on our children and future generations are certain to be worse than we can imagine. Therefore the moral issue relates to the choice between business-as-usual and some other thing.
We do not need government to make these choices, and we do not need government to make these choices known to the market or to any powers-that-be who may have any useful interest in our choices.
The greatest issues of our times have not been solved by government cooperation or action, but by moral action declared by conscious non-violent actions as evidence of the moral stand. The two great examples of the use of moral force are South Africa's abandonment of apartheid and India's freedom from the British. Neither of these remarkable events required the 'cooperation' of governments, but rather the governments fell beneath the force of the moral onslaught.
These shining lights contrast markedly with every other 'solution' that has been tried; with perhaps the notable exception of the elimination of CFCs in relation to the ozone layer depletion - which was achieved cooperatively because (again) the problem and solution were clear and morally it was the morally right thing to do.
There is no other practical way forwards for us;
*We must resolve and declare the nature of the moral issue in terms that the poorest most uneducated and disadvantaged members of our society can grasp, see the rightness of and act on;
*We must apply our individual moral force to the issue by 'becoming the change you want to see in the World' (MKG). If this change is seen as good, then it will encourage others to the rightness of the need for change.
*We must, if need-be, apply non-violent means, including civil non-cooperation against established institutions which are obstacles to the required change to achieve the morally correct end.
That is the only way to take this matter beyond individuals and get the movement that is necessary."
Thanks,
Nigel
2011/01/09
Another perspective - Arctic Ice Gone for Good by 2040?
This from October 2010 - a rather more scientific approach than mine earlier.
 A few days ago I used a combination of Arctic sea ice volume data from the University of Washington’s PIOMAS model and NSIDC sea ice extent numbers to project that the Arctic Ocean would be effectively ice-free in late summer within ten years. The key to that exercise was the rate at which the volume of sea ice has been declining ...
A few days ago I used a combination of Arctic sea ice volume data from the University of Washington’s PIOMAS model and NSIDC sea ice extent numbers to project that the Arctic Ocean would be effectively ice-free in late summer within ten years. The key to that exercise was the rate at which the volume of sea ice has been declining ...As I was saying...
Greenland - a turning point by around 2040.
http://beforeitsnews.com/story/346/855/Greenland_s_melting_seems_unstoppable.html
Berlingske Tidende
Friday 7 January 2011, 03:53
Friday 7 January 2011, 03:53
'Even if we turned off all power stations and threw the keys to our car away, we would probably be unable to put a stop to it.
'No matter how much we turn down the CO2-burner, Greenland will still reach a significantturning point by around 2040, writes Berlingske Tidende.
'Subsequently, the melting of the island's enormous quantities of ice will continue and continue and in principle not stop until most of the ice is gone.
"It is a very troubling result, because it shows that the melting can go much stronger than we usually imagine," says one of the article's authors, Jens Hesselberg Christensen,Berlingske Tidende.
'...A total meltdown of the ice cap will have the world's oceans to rise with six to seven meters.
2040. Say no more!
2011/01/01
Running Hot and Cold
The recent extreme cold events in Europe have understandably given some folk cause to mutter about the supposed direction of climate change and global temperatures.
But we can be assured that we are on track to our ultimate destination; plus more degrees C than normal civilised life can sustain.
Hansen sums it up thus:
Other recent research has attributed the same sea ice effect on the location of the jet streams, and this is found to be a primary cause of the European winter chills.
"It is nevertheless no contradiction between a global warming and cold winters in regions like Europe. Rather, recent analysis suggest that the global mean temperature is marching towards higher values (see figure below), and Petoukhov and Semenov argue that the cold winter should be an expected consequence of a global warming..." (Rasmus Benestad 20101214)
Running totals of sea ice cover are found at:
http://arctic.atmos.uiuc.edu/cryosphere/
in particular the long term record:
http://arctic.atmos.uiuc.edu/cryosphere/IMAGES/sea.ice.anomaly.timeseries.jpg
From the time series there is evidence of a steady (and increasingly rapid) decline in seasonal ice cover. The Cryosphere charts show that the minimum ice area has fallen from typical historic lows of about 5 million square kilometres to around three million.
But that is only part of the story. The surface of your glass of freshly made lemonade can be covered in ice if that ice is only a thin veneer or if it extends all the way to be bottom to be mashed and swizzled with your straw.
The volume of the sea ice is the key indicator of how things are going. The volume of Arctic sea ice figure is calculated every few weeks by the University of Washington's Polar Science Centre.
http://psc.apl.washington.edu/ArcticSeaiceVolume/IceVolume.php
 But while this shows the anomaly (the variance from a running trend) it does not give us a real clue about how much ice volume remains.
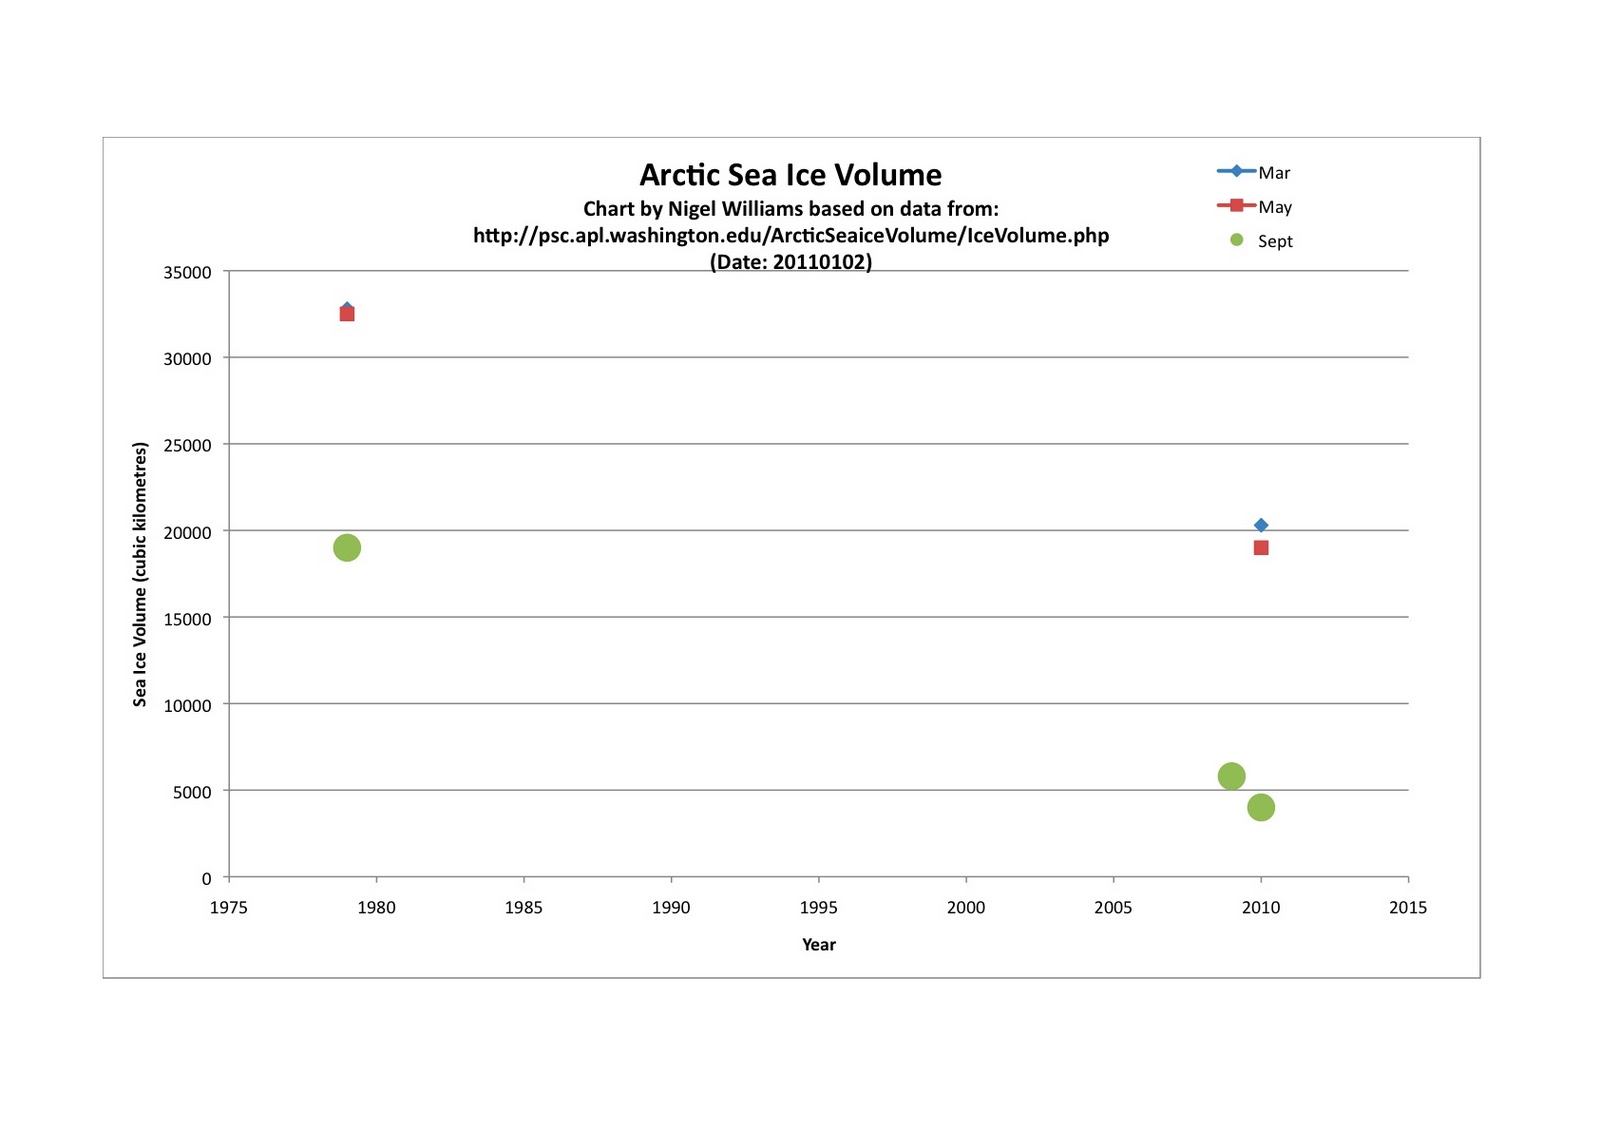
From the text and chart on the Washington U Ice Volume site I have extracted a few salient points which as far as I can tell give a true indication of how much ice is left in the Arctic glass.
 From this we can see that the summer minimum ice volume has diminished from the 1979 September minimum of 19,000 cubic kilometres to the 2010 September minimum of 4000 cubic kilometres.
I have not joined the dots with a curve, as its non-linear, and the site does not give me enough data to confidently make those interpolations. But the points for 1979, 2009 and 2010 provide sufficient evidence for us to see that, while sea ice cover is still remaining fairly high, the actual volume of ice beneath that cover is declining drastically. The ice on your glass is getting very thin indeed. A layman could be forgiven for drawing the conclusion that an ice-free arctic is not many seasons away.
With that ice goes an enormous heat sink and stabilising influence on the rate of global temperature rise, which will further hasten the rate of loss of grounded ice, and the consequent rate of sea level rise.
If we think back now to the present anomalous state of Europe's recent summer and winter weather with a very modest loss of Arctic sea ice cover, we can only begin to appreciate what may be in store when that last fragile 4000 cubic kilometres of Arctic ice turns to mush not many summers from now, and the lid comes off the Arctic Ocean Weather Machine.
Keep thinking. Keep acting.
Kind regards
Nigel
But we can be assured that we are on track to our ultimate destination; plus more degrees C than normal civilised life can sustain.
Hansen sums it up thus:
"...Sea ice insulates the atmosphere from ocean water warmth, allowing surface air to achieve temperatures much lower than that of the ocean. It is for this reason that some of the largest positive temperature anomalies on the planet occur in the Arctic Ocean as sea ice area has decreased in recent years.
The cold anomaly in Northern Europe in November has continued and strengthened in the first half of December. Combined with the unusual cold winter of 2009-2010 in Northern Hemisphere mid-latitudes, this regional cold spell has caused widespread commentary that global warming has ended. That is hardly the case. On the contrary, globally November 2010 is the warmest November in the GISS record...." (Hansen et al 20101211)
http://www.columbia.edu/~jeh1/mailings/2010/20101211_TemperatureAndEurope.pdfOther recent research has attributed the same sea ice effect on the location of the jet streams, and this is found to be a primary cause of the European winter chills.
"It is nevertheless no contradiction between a global warming and cold winters in regions like Europe. Rather, recent analysis suggest that the global mean temperature is marching towards higher values (see figure below), and Petoukhov and Semenov argue that the cold winter should be an expected consequence of a global warming..." (Rasmus Benestad 20101214)
http://www.realclimate.org/index.php/archives/2010/12/cold-winter-in-a-world-of-warming/
Both commentaries note the potential importance of Arctic sea ice cover.Running totals of sea ice cover are found at:
http://arctic.atmos.uiuc.edu/cryosphere/
in particular the long term record:
http://arctic.atmos.uiuc.edu/cryosphere/IMAGES/sea.ice.anomaly.timeseries.jpg
From the time series there is evidence of a steady (and increasingly rapid) decline in seasonal ice cover. The Cryosphere charts show that the minimum ice area has fallen from typical historic lows of about 5 million square kilometres to around three million.
But that is only part of the story. The surface of your glass of freshly made lemonade can be covered in ice if that ice is only a thin veneer or if it extends all the way to be bottom to be mashed and swizzled with your straw.
The volume of the sea ice is the key indicator of how things are going. The volume of Arctic sea ice figure is calculated every few weeks by the University of Washington's Polar Science Centre.
http://psc.apl.washington.edu/ArcticSeaiceVolume/IceVolume.php

The site comments:
"Monthly average Arctic Ice Volume for Sept 2010 was 4,000 km^3, the lowest over the 1979-2010 period, 78% below the 1979 maximum and 9,400 km^3 or 70% below its mean for the 1979-2009 period. "
From the text and chart on the Washington U Ice Volume site I have extracted a few salient points which as far as I can tell give a true indication of how much ice is left in the Arctic glass.
I have not joined the dots with a curve, as its non-linear, and the site does not give me enough data to confidently make those interpolations. But the points for 1979, 2009 and 2010 provide sufficient evidence for us to see that, while sea ice cover is still remaining fairly high, the actual volume of ice beneath that cover is declining drastically. The ice on your glass is getting very thin indeed. A layman could be forgiven for drawing the conclusion that an ice-free arctic is not many seasons away.
With that ice goes an enormous heat sink and stabilising influence on the rate of global temperature rise, which will further hasten the rate of loss of grounded ice, and the consequent rate of sea level rise.
If we think back now to the present anomalous state of Europe's recent summer and winter weather with a very modest loss of Arctic sea ice cover, we can only begin to appreciate what may be in store when that last fragile 4000 cubic kilometres of Arctic ice turns to mush not many summers from now, and the lid comes off the Arctic Ocean Weather Machine.
Keep thinking. Keep acting.
Kind regards
Nigel
Subscribe to:
Posts (Atom)


"Since the beginning of the 20th century, the seas have continued to rise at an average rate of 1.7 ± 0.5 mm per year, according to the IPCC (Bindoff et al., 2007). This increase, however, has not happened at a constant rate. The first noted increase was over the period of 1961 to 2003, when the average rate of sea level rise was 1.8 ± 0.5 mm per year (Church et al, 2001; Church and White, 2006; Bindoff et al., 2007). Global mean sea level measurements have become even larger since 1993. According to the IPCC, “For the period 1993 to 2003, the rate of sea level rise is estimated from observations with satellite altimetry as 3.1 ± 0.7 mm yr–1, significantly higher than the average rate.”
http://www.wunderground.com/climate/SeaLevelRise.asp?MR=1
So starting at 3.1mm/yr and using that rate doubling in say every 8 years gives over 75 metres rise before 2100, i.e. all grounded ice in the world melted. Most coastal cities (including most of London, Washington, Tokyo, Berlin and Beijing, for example) gone.
Not a good look!
Alternatively, if we use Hansen’s 1.0 mm rise contribution from ice sheets C2010, then we find (as Hansen’s figure 7 shows) we get to 5 metres sea level rise by 2095 with 10-year doubling in the rate of ice sheet loss, by year 2080 with 8-year doubling, and by 2065 with 6-year doubling; and of course the curves just keep on getting steeper after those dates; such is the nature of exponential growth. That is, the melt rate will continue to increase until the volume of ice left to melt starts to diminish, and then the melt will continue until all the ice is gone.
Neither of these approaches yield pleasant outcomes for humanity.
Nigel