But we can be assured that we are on track to our ultimate destination; plus more degrees C than normal civilised life can sustain.
Hansen sums it up thus:
"...Sea ice insulates the atmosphere from ocean water warmth, allowing surface air to achieve temperatures much lower than that of the ocean. It is for this reason that some of the largest positive temperature anomalies on the planet occur in the Arctic Ocean as sea ice area has decreased in recent years.
The cold anomaly in Northern Europe in November has continued and strengthened in the first half of December. Combined with the unusual cold winter of 2009-2010 in Northern Hemisphere mid-latitudes, this regional cold spell has caused widespread commentary that global warming has ended. That is hardly the case. On the contrary, globally November 2010 is the warmest November in the GISS record...." (Hansen et al 20101211)
http://www.columbia.edu/~jeh1/mailings/2010/20101211_TemperatureAndEurope.pdfOther recent research has attributed the same sea ice effect on the location of the jet streams, and this is found to be a primary cause of the European winter chills.
"It is nevertheless no contradiction between a global warming and cold winters in regions like Europe. Rather, recent analysis suggest that the global mean temperature is marching towards higher values (see figure below), and Petoukhov and Semenov argue that the cold winter should be an expected consequence of a global warming..." (Rasmus Benestad 20101214)
http://www.realclimate.org/index.php/archives/2010/12/cold-winter-in-a-world-of-warming/
Both commentaries note the potential importance of Arctic sea ice cover.Running totals of sea ice cover are found at:
http://arctic.atmos.uiuc.edu/cryosphere/
in particular the long term record:
http://arctic.atmos.uiuc.edu/cryosphere/IMAGES/sea.ice.anomaly.timeseries.jpg
From the time series there is evidence of a steady (and increasingly rapid) decline in seasonal ice cover. The Cryosphere charts show that the minimum ice area has fallen from typical historic lows of about 5 million square kilometres to around three million.
But that is only part of the story. The surface of your glass of freshly made lemonade can be covered in ice if that ice is only a thin veneer or if it extends all the way to be bottom to be mashed and swizzled with your straw.
The volume of the sea ice is the key indicator of how things are going. The volume of Arctic sea ice figure is calculated every few weeks by the University of Washington's Polar Science Centre.
http://psc.apl.washington.edu/ArcticSeaiceVolume/IceVolume.php

The site comments:
"Monthly average Arctic Ice Volume for Sept 2010 was 4,000 km^3, the lowest over the 1979-2010 period, 78% below the 1979 maximum and 9,400 km^3 or 70% below its mean for the 1979-2009 period. "
From the text and chart on the Washington U Ice Volume site I have extracted a few salient points which as far as I can tell give a true indication of how much ice is left in the Arctic glass.
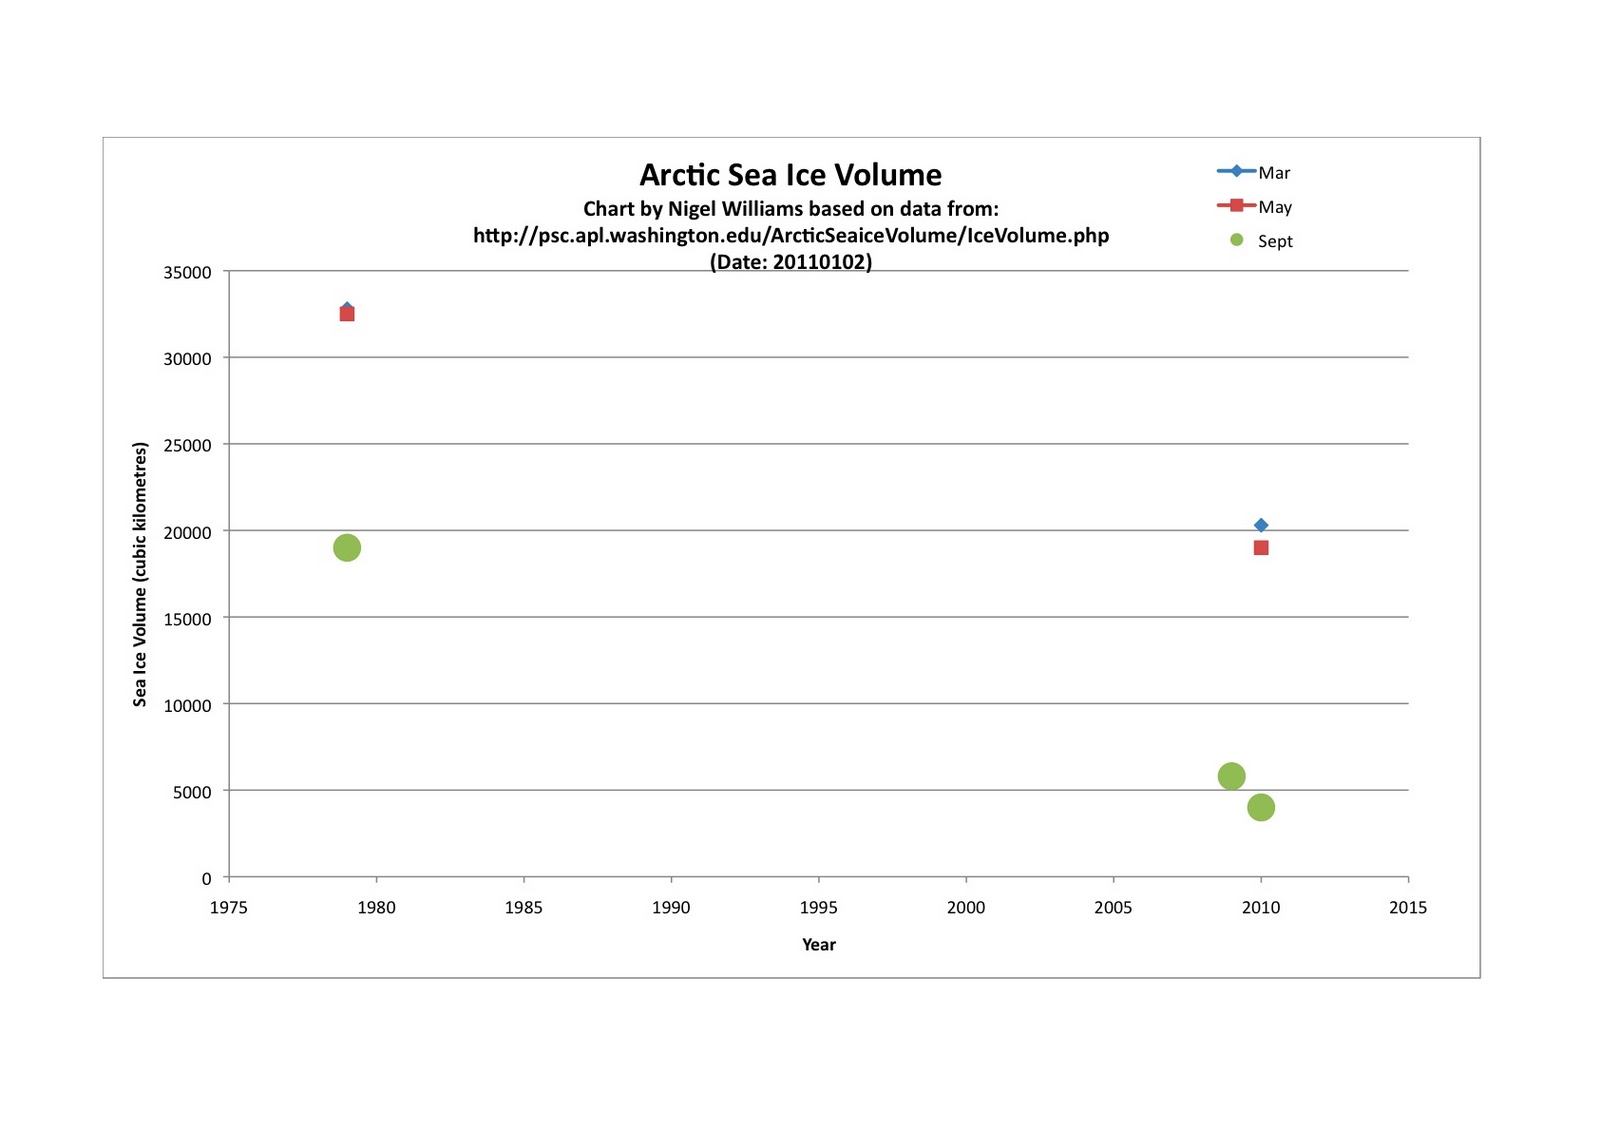
I have not joined the dots with a curve, as its non-linear, and the site does not give me enough data to confidently make those interpolations. But the points for 1979, 2009 and 2010 provide sufficient evidence for us to see that, while sea ice cover is still remaining fairly high, the actual volume of ice beneath that cover is declining drastically. The ice on your glass is getting very thin indeed. A layman could be forgiven for drawing the conclusion that an ice-free arctic is not many seasons away.
With that ice goes an enormous heat sink and stabilising influence on the rate of global temperature rise, which will further hasten the rate of loss of grounded ice, and the consequent rate of sea level rise.
If we think back now to the present anomalous state of Europe's recent summer and winter weather with a very modest loss of Arctic sea ice cover, we can only begin to appreciate what may be in store when that last fragile 4000 cubic kilometres of Arctic ice turns to mush not many summers from now, and the lid comes off the Arctic Ocean Weather Machine.
Keep thinking. Keep acting.
Kind regards
Nigel


My name is Olisa Blessing, I am so happy. I never believe I will be this happy again in life. I have worked as an air hostess ( cabin crew ) for 3years but early this year, I lost my job because of this deadly disease called Herpes virus (HSV).
ReplyDeleteI never felt sick or notice any symptoms. Not until the day all workers were asked to bring their doctors report card, that was how I got tested and I found out that I'm HSV positive and that made me lose my job because it was considered as an STD and is an incurable disease.
I was so depressed to the extent that I started thinking of suicide. I explained my situation to an older friend of mine, who often said to me 'a problem shared is a problem half solved.
She felt so pity for me that she referred me to Dr. Utu Herbal Cure, that was how I contacted Dr. Utu and got the medication from him and was cured for real.
I went back to my work a month later with my now HERPES VIRUS NEGATIVE test result. They thought it was a cloned result or maybe human error so they carried out another test on me in their lab to be very sure and they found out I am indeed HERPES VIRUS NEGATIVE.
Finally, the initial result was replaced with my new HERPES VIRUS NEGATIVE test results and my duty was restored to me with an apology letter and a salary increase.
Beware of impersonators,
Dr. Utu can only be reached at:
drutuherbalcure@gmail.com.