2009/12/03

Major sea level rise likely as Antarctic ice melts - 1.4 metres by 2100

New studies find higher rates likely:
http://news.bbc.co.uk/2/hi/science/nature/8387137.stm

Quotes:

"Sea levels are likely to rise by about 1.4m (4ft 6in) globally by 2100 as polar ice melts, according to a major review of climate change in Antarctica.

"Conducted by the Scientific Committee on Antarctic Research (SCAR), it says that warming seas are accelerating melting in the west of the continent.


and from:
Rising sea levels: A tale of two cities
http://news.bbc.co.uk/2/hi/science/nature/8369236.stm

"Off the Netherlands, for example, sea levels rose by some 20cm in the last 100 years. But the country's national Delta Commission predicts they will increase by up to 1.3m by 2100 and by as much as 4m by 2200.

---
Thats not a bad fit with the curve...

2009/09/05

80m Sea Rise - Maps for Caribbean and South America

Using Google Maps and the Sea Level Rise applet, the following maps show 80 metres of sea level rise.


Areas shaded red are those areas inundated.


Central America


Caribbean Islands


South America


Amazon Basin


Buenos Aires


I strongly recommend you check with your local maps to review the location of the 80 metre contour in your area of interest.


80m Sea Rise maps - Japan, China, Asia and South East Asia

Using Google Maps and the Sea Level Rise applet, the following maps show 80 metres of sea level rise.


Areas shaded red are those areas inundated.


Japan


Beijing and Shanghai


Central China

Vietnam and Southern China


Vietnam, Cambodia and Burma

Borneo

Philippines

Indonesia (West)

Indonesia (East)


Irian Jaya / Papua New Guinea


I strongly recommend you check with your local maps to review the location of the 80 metre contour in your area of interest.


80m Sea Rise maps - Africa, Middle East, Pakistan, India, Bangladesh


Using Google Maps and the Sea Level Rise applet, the following maps show 80 metres of sea level rise.


Areas shaded red are those areas inundated.


Africa

South-East Mediterranean - Egypt

Iraq - Pakistan

Pakistan (Detail)

India-Bangladesh


I strongly recommend you check with your local maps to review the location of the 80 metre contour in your area of interest

2009/08/07

The 'Other Problem'. Resource Depletion and Climate Change


While a little off-topic, the following is a New Zealand perspective on the issue of resource depletion. Since we need these resources to meaningfully address our past and future influence on climate and sea level rise, it is pertinent to consider these matters.


In summary:

*IEA says that oil production is now declining at 6.7% per year and there is no prospect of an upturn in production.

*Shell, BP, Mobil and Caltex are all attempting to sell their retail fuel systems in New Zealand as there is no future in the business. Now.

*New Zealand's only oil refinery is up for sale, and the most likely buyer is a USA refiner who needs Marsden Point's production to serve the USA market. Now.

*All the gas production from Taranaki is owned by an 100% overseas operator, who exports it all elsewhere.


Conclusion:

When these sales go through then the security of New Zealand's fuel supply to domestic consumers will drop to third-world levels.


We will have very limited bargaining power for supply of crude, and even less for supply of usable fuels: Diesel, Petrol and Gas.


This threat is real, and current, and confirms that we have a very short window of time to do anything about climate change and sea level rise, while at the same time the depletion of oil and other resources has a direct impact on our day to day survival.


It seems to me that we should use the time and resources we have to relocate critical national infrastructure above the 100 metre line, and to commence an urgent Cuba-style adoption of in-city food production to reduce our dependance on fossil fuels for food production and transport.


---

Big gas pulling out of the pumps


By GARRY SHEERAN - Sunday Star Times


Last updated 05:00 26/07/2009

http://www.stuff.co.nz/business/2674283/Big-gas-pulling-out-of-the-pumps


Petroleum industry watchers say all four oil company majors could exit the local

retail market and revolutionise the ownership of NZX-listed NZ Refining.


It's understood Exxon Mobil has joined Shell in seeking buyers for its

downstream retail assets, including extensive service station networks and

shares in the Whangarei-based refinery company. Negotiations on the sale of both

stakes are understood to be well advanced.


McDouall Stuart analyst John Kidd said all four globally owned companies were

facing tight margins on petrol sales in a mature, over-pumped local market with

little growth opportunity.

…etc

---


US firm seen eyeing NZ refinery


By GARETH VAUGHAN – BusinessDay


Last updated 13:41 24/07/2009

http://www.stuff.co.nz/business/industries/2671676/US-firm-seen-eyeing-refinery


Valero Energy, the biggest US oil refiner, may be seeking to buy this country's

sole oil refinery the New Zealand Refining Company, Bloomberg News reported.


The report comes after The Independent revealed yesterday that Exxon Mobil was

looking to sell its New Zealand petrol stations, tank farms and 19.2 percent

stake in NZ Refining. Shell also has a series of Kiwi assets on the block

including its 17.4 percent NZ Refining stake.


That means a total of 36.34 percent of NZ Refining is up for sale. Other major

shareholders in the Marsden Point-based refiner include BP with 23.66 percent,

Chevron with 12.69 percent and the Canadian owned Emerald Capital with 13.12

percent.

…etc

---


Now I wonder WHY there is `little growth opportunity' in the local market? I

don't think it is because we wouldn't use more if we could get it; so maybe its

because they know there is no more to give us?


Why would they be flicking off the local retail arm, unless it is to get out of

a market that is about to collapse? And why try to seize control of our only

refining capacity, unless they wanted the capacity to spin product away to other

markets?

---

---

Warning: Oil supplies are running out fast


http://www.independent.co.uk/news/science/warning-oil-supplies-are-running-out-f\

ast-1766585.html


Catastrophic shortfalls threaten economic recovery, says world's top energy

economist

By Steve Connor, Science Editor

Monday, 3 August 2009


The world is heading for a catastrophic energy crunch that could cripple a

global economic recovery because most of the major oil fields in the world have

passed their peak production, a leading energy economist has warned.


Higher oil prices brought on by a rapid increase in demand and a stagnation, or

even decline, in supply could blow any recovery off course, said Dr Fatih Birol,

the chief economist at the respected International Energy Agency (IEA) in Paris,

which is charged with the task of assessing future energy supplies by OECD

countries.


...

The IEA estimates that the decline in oil production in existing fields is now running at 6.7 per cent a year compared to the 3.7 per cent decline it had estimated in 2007, which it now acknowledges to be wrong.

...


http://www.theoildrum.com/node/5638

Temporary Recession or the End of Growth?

Posted by Gail the Actuary on August 6, 2009 - 10:25am


This is a guest post by Richard Heinberg. Richard is a Senior Fellow of the Post Carbon Institute and author of five books on resource depletion and societal responses to the energy problem. He can be found on the web at www.richardheinberg.com and www.postcarbon.org.


...About 85 percent of our current energy is derived from three primary sources—oil, natural gas, and coal—that are non-renewable, whose price is likely to trend sharply higher over the next years and decades leading to severe shortages, and whose environmental impacts are unacceptable. While these sources historically have had very high economic value, we cannot rely on them in the future; indeed, the longer the transition to alternative energy sources is delayed, the more difficult that transition will be unless some practical mix of alternative energy systems can be identified that will have superior economic and environmental characteristics....


...The winding down of this historic growth-contraction pulse doesn’t necessarily mean the end of the world, but it does mean the end of a certain kind of economy. One way or another, humanity must return to a more normal pattern of existence characterized by reliance on immediate solar income (via crops, wind, or the direct conversion of sunlight to electricity) rather than stored ancient sunlight....


...However, while there is not as yet general agreement on the point, climate change itself and the needed steps to minimize it both constitute limits to growth, just as resource depletion does. Moreover, if we fail to successfully manage the inevitable process of economic contraction that will characterize the coming decades, there will be no hope of mounting an organized and coherent response to climate change—a response consisting of efforts both to reduce climate impacts and to adapt to them. It is important to note, though, that the measures advocated here (including the development of renewable energy sources and energy efficiency, a rapid reduction of reliance on fossil fuels in transport and agriculture, and the stabilization of population levels) are among the steps that will help most to reduce carbon emissions.

...


http://www.choicesmagazine.org/2003-4/2003-4-01.htm


Cuba has transformed its agriculture from a low productivity, highly subsidized, high input system to one that is more productive and greener, while removing subsidies.


But its not perfect by any means:


http://www.cnn.com/2008/WORLD/americas/04/16/cuba.farming/index.html

HAVANA, Cuba (CNN) -- President Raúl Castro has moved quickly since taking the reins of power from his ailing brother, Fidel, last year to boost food production by putting more land into the hands of profit-earning farmers.

Government officials hope that, with more land into production, the nation would need to import less food.


And so on...


Nigel


2009/08/03

The First Sign Erected

On 2nd August 2009 I put together the first High Tide sign, and screwed it to a tree at my gate, clearly visible from the road.

The sign was produced by a print-shop enlarging the A4-sized notice to metric A0 size on paper, then laminating it to make it weather-proof. I then screwed it to an 1200mm x 800mm bit of plywood which was screwed to the tree. That is a nice readily read sign and will do well for road-side installations.


As usual one gets around to doing these things last thing Sunday afternoon, so the first pix is just after dark!


But it looks pretty good too by the light of day.

The view in the distance is of the rolling country north of Albany, Auckland. Incredible to think of all that going under water.

Looking forward to hearing of more signs!

2009/07/30

80m Sea Rise maps - Australia


Using Google Maps and the Sea Level Rise applet, the following maps show 80 metres of sea level rise.
Areas shaded red are those areas inundated. (Click on map symbol to see enlargements.) 


Australia

Adelaide


Detail of Porters Hill - the ridge keeping the ocean out of the Lake Eyre Basin.  About 4km, and only a few tens of metres above 80m.  
It won't last long.   Be there when that breaks through!


Melbourne


Sydney

Brisbane


I strongly recommend you check with your local maps to review the location of the 80 metre contour in your area of interest.

2009/07/29

Now: Why it's even worse than we feared.

In relation to the Science behind my estimates of sea level rise we can now add the information from an article by Sharon Begley at newsweek.com published 24 July 2009. Sharon pulls together some recent views on the state of the ice on and around Greenland. Read the article for the details.


http://www.newsweek.com/id/208164


Some quotes:


...the sea ice found a more open, ice-free, and thus faster path westward thanks to Arctic melting.


...The loss of Arctic sea ice "is well ahead of" what the Intergovernmental Panel on Climate Change forecast, largely because emissions of carbon dioxide have topped what the panel—which foolishly expected nations to care enough about global warming to do something about it—projected. "The models just aren't keeping up" with the reality of CO2 emissions, says the IPY's David Carlson.


... satellite measurements of Greenland's mass, show that it is losing about 52 cubic miles per year and that the melting is accelerating. So while the IPCC projected that sea level would rise 16 inches this century, "now a more likely figure is one meter [39 inches] at the least," says Carlson. "Chest high instead of knee high, with half to two thirds of that due to Greenland." Hence the "no idea how bad it was."


...estimates of how much carbon is locked into Arctic permafrost were, it turns out, woefully off. "It's about three times as much as was thought, about 1.6 trillion metric tons, which has surprised a lot of people," says Edward Schuur of the University of Florida. "It means the potential for positive feedbacks is greatly increased." That 1.6 trillion tons is about twice the amount now in the atmosphere. And Schuur's measurements of how quickly CO2 can come out of permafrost, reported in May, were also a surprise: 1 billion to 2 billion tons per year. Cars and light trucks in the U.S. emit about 300 million tons per year.


...the G8, led by Europe, has vowed to take steps to keep global warming below 2 degrees Celsius by reducing CO2 emissions. We're now at 0.8 degree. But the amount of CO2 in the atmosphere is already enough to raise the mercury 2 degrees. The only reason it hasn't is that the atmosphere is full of crap (dust and aerosols that contribute to asthma, emphysema, and other diseases) that acts as a global coolant. As that pollution is reduced for health reasons, we're going to blast right through 2 degrees, which is enough to ex-acerbate droughts and storms, wreak havoc on agriculture, and produce a planet warmer than it's been in millions of years.


...The test of whether the nations of the world care enough to act will come in December, when 192 countries meet in Copenhagen to hammer out a climate treaty. Carlson vows that IPY will finish its Arctic assessment in time for the meeting, and one conclusion is already clear. "A consensus has developed during IPY that the Greenland ice sheet will disappear," he says.


Now what happens to Greenland will also be mirrored in the Antartic, where as detailed in previous posts and below, the West Antarctic Ice Sheet is showing signs of distress. The combination serves to push the "Very Likely" sea level rise closer to two metres, and the possible worst case through my estimated five metres.


I insure my house against fire for the possible worst case. I don't know anybody who has had their house burned down, do you? But we all act to protect ourselves and our record collections against the conceivable worst case. Five metres is conceivable, and even more so in terms of these latest discoveries by the International Geophysical Year scientists.


We should act accordingly.

2009/07/13

The only number that matters...

My reason for hammering on about the two perils of sea level rise and resource depletion is that these will impose enormous demands on society to cope with - not the least being replacing coastal area's food production and the relocation of living places and critical infrastructure and production capacity to high ground. But as part of the attacking pincer movement we are exposing ourselves to, right when we need to start the biggest building effort the world has ever seen to get away from the coast we are running out of our primary energy source for construction.

Thus we only have a very short window of time (maybe 20 to 50 years at the most) to rebuild the fabric of our coastal civilisation someplace else before we run out of the energy we need to do that. And since we only have the time and resources to do this once. ONCE. Then we must do it where it will be SAFE from whatever is coming.

The level of the ocean at your place or mine in 2100 is irrelevant - it is just a marker on a journey to the finished level of +80 metres.

Eightly (80) metres of sea level rise is coming. We know this. This is the only number that matters. So we have a duty to only expend our diminishing resources ABOVE that level, or else with good cause our names will go down in infamy with our children and our grandchildren, 'yea unto the n-th generation'.

The simple point is that WE KNOW THIS IS GOING TO HAPPEN sooner or later. To pretend anything else is to deny our children what ever small chance at survival we can give them.

I want to be able to look my grandchildren in their eyes, and say "I knew, and I tried."

Nigel

2009/07/07

A sign!

Five degrees and five metres by 2100?

New information is suggesting that temperature rise may exceed current IPCC expectations. Five degrees Celsius is bound to give rise to more than just 2 metres sea level rise.

In my view, while 2 metres was strongly supported by people like Dr Hansen under 2008 Business as Usual scenarios, this recent information making it likely that we will get 5 degrees Celsius warming by 2100 leads me to recommend that we use the 5 metres by 2100 table and chart here as our basis for sign locations.

5 & 5 by 2100. Gulp!

This condition could give rise to accelerated ice loss, and hence sea level rise.

Thus by 'eyeometry' a curve fitted to past and expected long term SLR could entail this data:

DATE (YEAR AD)SLR (m)
18000
19000.02
20000.2
20250.5
20501.4
20752.9
21005
220015
230027
240040
250052
260059.5
270063.5
280066.5
290068.5
300070
310071
400075
500077.5

and look like this:


and in detail

(Click on images for enlarged view)

This could be a more realistic view of our imminent future to use in our depictions of the Sea Level Rise that is coming.

So find out how far above high water your site is, and interpolate values from the above table or charts to figure out what date to write on your sign.

2009/06/10

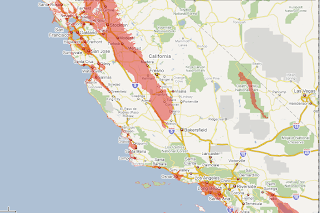
80m Sea Rise - Maps for North America


Using Google Maps and the Sea Level Rise applet, the following maps show 80 metres of sea level rise.

Areas shaded red are those areas inundated.

North East USA and Canada

South East USA
South West USA
North West USA and Canada
Anchorage


I strongly recommend you check with your local maps to review the location of the 80 metre contour in your area of interest.


2009/06/09

80m Sea Rise - Maps for New Zealand


Using Google Maps and the Sea Level Rise applet, the following maps show 80 metres of sea level rise.

Areas shaded red are those areas inundated.

North Island

South Island

Auckland Area
Hawkes Bay
Manawatu
Wellington
Nelson Blenheim
West Coast
Invercargill
Dunedin
Christchurch


I strongly recommend you check with your local maps to review the location of the 80 metre contour in your area of interest.